
8 Beyond the Numbers: A Deeper Look at Economic Well-Being
The ways we measure a country’s economic performance provide us with valuable insights, but they are just the starting point. Our real goal is to equip people with the ability to observe, question, and critically analyse what’s happening around them. A strong economy is not just about producing more goods or increasing income – it is about how these economic activities translate into real improvements in people’s lives. Understanding this requires individuals to develop the skills needed to make informed economic and political decisions, rather than simply accepting surface-level statistics. In this section, we will go beyond traditional indicators and introduce a few more key measures that help us paint a fuller picture of economic well-being.
Economic performance is often assessed through numbers and financial calculations, but sometimes, we need to step beyond these figures to grasp what really shapes people’s experiences. For example, GDP per capita – which measures the average income per person – is undeniably an important metric. However, an increase in GDP per capita does not automatically translate to happiness or a better quality of life. A rising income may improve access to material goods, but it does not necessarily mean people feel healthier, more secure, or more fulfilled in their daily lives.
Happiness, well-being, and overall life satisfaction depend on many other factors. This is where the Happiness and Well-Being Indicators come into play, helping us understand how economic conditions affect people’s day-to-day lives. They remind us that a thriving economy is not just about earning more money but also about health, social connections, and overall life quality. Countries with high income levels but low life satisfaction scores often highlight the limitations of traditional economic measurements, proving that financial prosperity alone is not enough.
Similarly, the Genuine Progress Indicator (GPI) steps in to address the shortcomings of GDP. While GDP simply measures economic activity, GPI takes a more realistic approach by incorporating social and environmental costs and benefits. It considers whether economic growth is actually improving people’s lives or merely contributing to rising inequality, environmental destruction, and social instability. A nation may experience rapid economic expansion, but if this growth leads to increased pollution, longer working hours, and rising mental health problems, is it truly progress? GPI challenges us to rethink how we define success, ensuring that economic performance is measured in a way that reflects real human well-being.
Another key measure is the Human Development Index (HDI), which shifts our focus away from pure income statistics. Rather than looking solely at wealth, HDI evaluates a country’s progress based on three fundamental dimensions of human well-being: life expectancy, reflecting the overall health and longevity of a population; education, which includes access to schooling and the average years of education received; and income, adjusted for purchasing power, ensuring a more accurate comparison between countries. This index challenges the idea that economic success is simply about money – it is also about what people can actually do with their resources and opportunities. A society where people live long, receive quality education, and have meaningful job opportunities is one that fosters true development, regardless of how high or low its GDP may be.
Three-column table listing rank, country, and Human Development Index (HDI) score for 2022.
HDI scores range from 0 to 1, with higher values indicating greater human development.
| Rank | Country | HDI Score |
|---|---|---|
| 1 | Switzerland | 0.967 |
| 2 | Norway | 0.966 |
| 3 | Iceland | 0.959 |
| 4 | Hong Kong | 0.956 |
| 5 | Australia | 0.952 |
| 6 | Denmark | 0.950 |
| 7 | Sweden | 0.949 |
| 8 | Ireland | 0.946 |
| 9 | Germany | 0.942 |
| 10 | Netherlands | 0.940 |
| 11 | Singapore | 0.939 |
| 12 | Finland | 0.937 |
| 13 | Canada | 0.935 |
| 14 | New Zealand | 0.929 |
| 15 | United States | 0.927 |
| 16 | United Kingdom | 0.926 |
| 17 | Belgium | 0.920 |
| 18 | Liechtenstein | 0.915 |
| 19 | Japan | 0.911 |
| 20 | Austria | 0.910 |
Note: HDI scores range from 0 to 1, with higher values indicating greater human development.
Three-column table listing rank, country, and Human Development Index (HDI) score for 2022.
HDI scores range from 0 to 1, with higher values indicating greater human development.
| Rank | Country | HDI Score |
|---|---|---|
| 174 | Guinea-Bissau | 0.461 |
| 175 | Mozambique | 0.458 |
| 176 | Sierra Leone | 0.438 |
| 177 | Burkina Faso | 0.426 |
| 178 | Eritrea | 0.425 |
| 179 | Mali | 0.410 |
| 180 | Burundi | 0.394 |
| 181 | South Sudan | 0.394 |
| 182 | Chad | 0.387 |
| 183 | Niger | 0.381 |
Note: HDI scores range from 0 to 1, with higher values indicating greater human development.
The HDI rankings reveal significant disparities in human development across the globe. Countries like Switzerland, Norway, and Iceland consistently occupy the top positions, reflecting their strong performance in health, education, and income. These nations typically exhibit high life expectancy, advanced educational systems, and robust economies, contributing to their elevated HDI scores.
Conversely, countries at the lower end of the HDI spectrum, such as Niger, Chad, and South Sudan, face challenges including limited access to healthcare, lower educational attainment, and reduced income levels. These factors collectively result in lower HDI scores, highlighting areas requiring targeted development efforts.
While Gross Domestic Product (GDP) per capita is a common indicator of economic performance, it does not encompass the broader aspects of human development captured by the HDI. For instance, a country may have a high GDP per capita, indicating substantial economic output, but still rank not that high on the HDI if disparities exist in health and education sectors.
The United States, with a GDP per capita of approximately $63,000, ranks 15th on the HDI list. Yes, the United States still ranks quite well in HDI at 15th place, despite its economic and social challenges. While the U.S. has high income inequality and healthcare accessibility issues, it remains a global leader in education, innovation, and economic opportunity, which keeps its HDI score relatively high. However, a far more striking example of why high GDP per capita doesn’t always translate to a high HDI ranking is Qatar.
Qatar is one of the richest countries in the world by GDP per capita. In 2023, its GDP per capita was approximately $83,000, ranking among the top 10 globally. However, when it comes to Human Development Index (HDI), Qatar ranks around 44th, significantly lower than many other high-income nations.
Why Does Qatar Rank Lower in Human Development Despite Its Wealth?
At first glance, Qatar’s immense wealth, largely derived from its oil and gas exports, might suggest it should rank among the highest in the Human Development Index (HDI). However, a closer look reveals that economic prosperity doesn’t always translate into broad-based human development. Several factors help explain why Qatar, despite having one of the highest GDP per capita figures in the world, lags behind countries like Norway, Switzerland, and Australia in HDI rankings.
1. Unequal Distribution of Wealth
While Qatar’s energy sector generates extraordinary revenues, this wealth is not shared evenly across the population. A small segment of the Qatari elite enjoys the lion’s share of national income, while the vast majority of the workforce, composed mostly of migrant workers – receives far less. Over 85 percent of the working population in Qatar consists of foreign labourers, many of whom earn minimal wages and lack basic labour rights. This extreme income inequality plays a significant role in suppressing the country’s HDI score.
2. Modest Social Development Relative to Economic Size
Unlike countries that consistently score high on HDI, such as Norway and Australia, Qatar has not yet achieved comparable development in key social sectors like healthcare and education. Although public services exist, their quality and accessibility vary, especially for non-citizens who make up the majority of the population. In many cases, these services do not meet the same standards available to nationals, resulting in uneven outcomes across different segments of society.
3. Migrant Labour Conditions and Human Rights
Qatar has faced widespread international criticism over its treatment of migrant workers, particularly in the construction and domestic service sectors. Many workers live in overcrowded accommodations, earn low wages, and lack effective legal protection. These conditions can negatively affect both physical and mental well-being, leading to reduced life expectancy and quality of life, two key components of the HDI.
4. Challenges in Education and Skills Development
Despite its economic power, Qatar’s performance in education remains modest when compared to other high-income nations. Participation in higher education is relatively limited, and investment in human capital development has not kept pace with economic growth. In contrast, top-ranking HDI countries have long prioritised education as a critical tool for enhancing overall human development and ensuring long-term prosperity.
In summary, while Qatar is undeniably wealthy, the benefits of that wealth are not equally felt across its population. The country’s HDI ranking reflects deeper issues related to social inclusion, labour rights, and public investment in human development, reminding us that prosperity alone is not enough to guarantee a high quality of life for all.
Four-column table comparing Qatar and Norway on GDP per capita (2023), HDI rank (2023), and key development strengths.
| Country | GDP Per Capita (2023) | HDI Rank (2023) | Key Development Strengths |
|---|---|---|---|
| Qatar | ~$83,000 | 44th | High income, but inequality and migrant labor issues |
| Norway | ~$92,000 | 2nd | Strong social policies, universal education & healthcare |
This stark contrast between Qatar and Norway shows that wealth alone does not guarantee human development. Norway reinvests its wealth into social infrastructure, ensuring that all citizens have access to high-quality education, healthcare, and social security. In contrast, Qatar, despite its enormous wealth, still ranks far lower in HDI because its development model prioritises economic growth over social inclusivity.
Regional Insights:
Sub-Saharan Africa
Many countries in Sub-Saharan Africa occupy the lower ranks of the HDI. Challenges such as political instability, limited infrastructure, and health crises like HIV/AIDS have impeded progress in human development. However, there are positive trends, with nations like Rwanda and Ethiopia making significant strides in improving education and healthcare systems, leading to gradual improvements in their HDI scores.
East Asia and the Pacific
This region showcases a diverse range of HDI scores and economic standings. Countries like Hong Kong, Singapore, Japan, and South Korea rank highly, reflecting their advanced economies, strong education systems, and comprehensive social services. These nations have successfully leveraged technological innovation, global trade, and investment in human capital to achieve high human development levels.
China, while having one of the world’s largest economies, has a lower HDI ranking compared to its economic peers, highlighting the challenges of income inequality, rural-urban development gaps, and access to high-quality social services. Despite this, China has made significant strides in education and healthcare, contributing to its steady improvement in HDI over time.
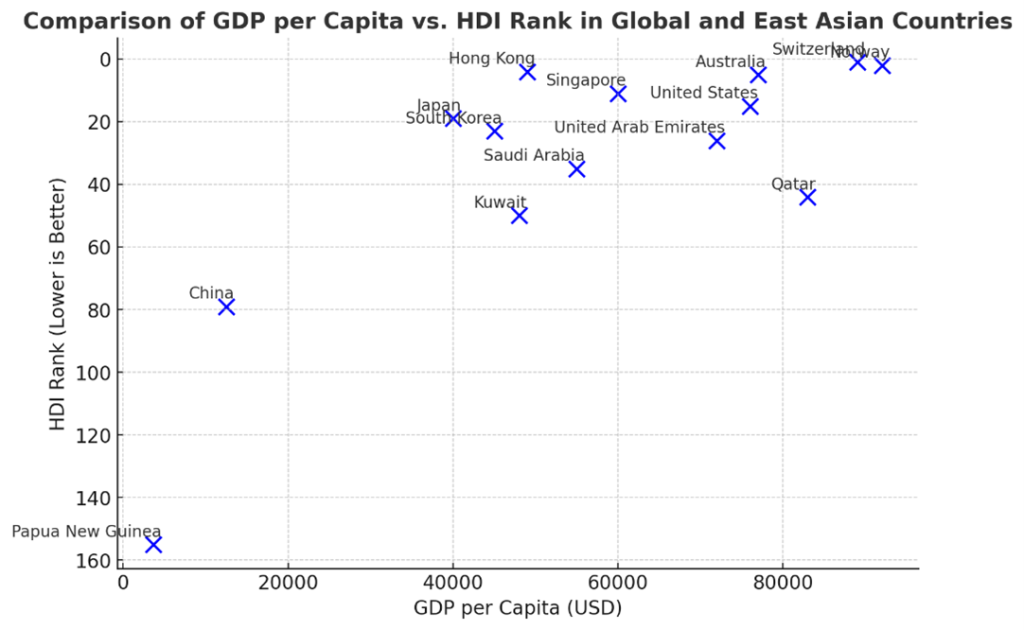
In contrast, nations like Papua New Guinea face substantial developmental challenges, ranking significantly lower in HDI. Limited access to basic healthcare, education, and infrastructure hinders progress, despite gradual economic improvements. Similarly, countries like Kuwait and Saudi Arabia, which have high GDP per capita due to oil wealth, do not necessarily rank among the top HDI countries, as economic prosperity has not translated equally into broad-based social development and human capital investment.
The disparity within the region highlights the varying stages of development and the impact of effective policy implementation. Nations that prioritise inclusive economic growth, social welfare, and education tend to score higher in HDI, while those focused solely on economic expansion without parallel human development initiatives see a disconnect between their wealth and quality of life indicators.
Traditional poverty measures often focus solely on income levels, assuming that financial earnings are the primary determinant of well-being. However, poverty is far more complex and extends beyond monetary constraints. A household might earn above the official poverty line yet still lack access to essential services such as clean water, healthcare, and education. The Multidimensional Poverty Index (MPI) offers a more comprehensive framework for assessing poverty by capturing multiple dimensions of deprivation. Unlike conventional income-based poverty indicators, the MPI takes into account factors such as health, education, and living standards, painting a clearer picture of how well people’s basic needs are being met.
The MPI evaluates poverty across three fundamental dimensions, each encompassing several indicators. Health plays a critical role, as a lack of proper medical care directly affects life expectancy and overall well-being. High child mortality rates indicate systemic healthcare deficiencies, while malnutrition highlights food insecurity, even in middle-income countries. Education, another crucial component, is measured through years of schooling and school attendance rates. The absence of access to quality education hinders social mobility and economic opportunity, trapping individuals in cycles of poverty. Living standards complete the framework by assessing access to electricity, sanitation, drinking water, adequate housing, and basic household assets. Deprivations in these areas often mean that even individuals with a stable income struggle to achieve a decent quality of life.
The MPI reveals stark contrasts across different regions and within individual countries. Sub-Saharan Africa remains one of the most affected regions, with countries such as Niger, Chad, and South Sudan exhibiting some of the highest multidimensional poverty rates in the world. In Niger, for example, over 80% of the population experiences multiple deprivations, particularly in education and healthcare. Limited school infrastructure and teacher shortages have left millions of children without proper schooling, contributing to one of the lowest literacy rates globally. Similarly, inadequate healthcare facilities and food shortages result in high levels of malnutrition and preventable diseases.
South Asia, another region with high MPI values, presents a different set of challenges. Countries like India, Bangladesh, and Pakistan have made progress in reducing income poverty, but multidimensional poverty remains a pressing issue. India, for instance, has seen rapid economic growth in recent decades, yet millions still lack access to basic sanitation, clean drinking water, and quality education. The persistence of child malnutrition and high rates of school dropout in rural areas underscores the limitations of measuring poverty solely through income statistics. In Bangladesh, despite improvements in education, maternal health and access to safe water remain areas of concern, disproportionately affecting rural communities.
In contrast, Latin America and the Caribbean show a more mixed picture. While countries like Chile, Argentina, and Costa Rica have relatively low MPI values due to strong social policies, nations such as Haiti and Venezuela continue to struggle with severe multidimensional poverty. Haiti, in particular, suffers from systemic issues related to poor healthcare infrastructure, lack of clean water, and inadequate housing, leaving a significant portion of the population vulnerable to disease and natural disasters. Venezuela’s economic crisis has exacerbated its MPI indicators, with deteriorating healthcare services and food shortages worsening conditions for many citizens.
Even within Middle Eastern and Gulf nations, where GDP per capita is relatively high, MPI disparities persist. Countries like Qatar, Saudi Arabia, and the United Arab Emirates have some of the world’s highest income levels, yet pockets of poverty remain, particularly among low-income migrant workers. These populations often live in overcrowded housing, lack access to essential healthcare, and experience restricted labor rights, leading to forms of deprivation that are not captured in traditional income measures.
East Asia and the Pacific provide another intriguing case. Countries such as China, Japan, and South Korea exhibit vastly different MPI results despite being in the same geographic region. China has dramatically reduced income poverty over the past four decades, but multidimensional poverty still exists, particularly in rural provinces where access to education and healthcare lags behind urban centers. Japan and South Korea, by contrast, have some of the lowest MPI values in the world, reflecting their strong investments in social welfare, universal healthcare, and high educational attainment. Yet even in these countries, certain marginalised groups, such as the elderly in Japan or low-income households in South Korea, face specific deprivations that require policy attention.
Understanding the MPI’s implications is essential for policymakers, as it provides a roadmap for addressing the root causes of poverty. Governments that focus solely on raising income levels without considering access to healthcare, education, and infrastructure may fail to achieve meaningful progress in human development. The MPI allows for targeted interventions by identifying specific areas of deprivation within a country or region. In India, for instance, regional disparities mean that while urban centres like Delhi and Mumbai have relatively low MPI values, states such as Bihar and Uttar Pradesh experience much higher levels of multidimensional poverty. Similarly, in Brazil, coastal cities like Rio de Janeiro and São Paulo boast high human development levels, whereas the country’s interior and Amazonian regions struggle with poverty, malnutrition, and limited healthcare access.
The real power of the MPI lies in its ability to guide governments in crafting tailored, data-driven policies rather than relying on one-size-fits-all economic strategies. Countries that have successfully reduced multidimensional poverty have done so through comprehensive social programmes, investing in free or low-cost healthcare, improving school infrastructure, and expanding access to clean water and sanitation. Nations like Vietnam and Rwanda have demonstrated how focused government initiatives can lift millions out of poverty, not just by increasing incomes but by improving the overall quality of life.
Unlike traditional poverty measures that rely on income thresholds, the Multidimensional Poverty Index reveals hidden inequalities that persist even in middle- and high-income countries. Many people may earn enough to escape monetary poverty yet still lack the essential services necessary for a dignified life. The MPI provides a more accurate and nuanced picture of poverty, ensuring that no one is left behind in the pursuit of sustainable development.
With these expanded indicators, Happiness and Well-Being Indicators, GPI, HDI, and MPI, we can build a much deeper and more accurate understanding of the world around us. Whether we are analysing our own country or examining the global economy, these tools help us see beyond the surface, allowing us to ask more meaningful questions about who truly benefits from economic growth and how we can ensure prosperity is shared more fairly and sustainably. Instead of assuming that a rising GDP equates to success, we must consider whether economic progress is truly enhancing the quality of life, opportunities, and long-term sustainability of our societies. By embracing these broader perspectives, we move closer to a world where economic decisions are not just about numbers but about people, communities, and the future we want to create.
