
13 Choosing Our Future: High-Value Production or Remaining a Source of Cheap Labour?
A service-orientated economy is one of the characteristics of developed countries. In the UK, this sector accounts for 81 per cent of the entire labour market. So what’s in this service sector? Computer, banking, education, tourism, distribution, and transportation services are some of them. IT’S MOVING FAST. In many European countries, the service sector is well above 70 per cent. 80 per cent in countries such as England and America. In Gibraltar, the British territory on the coast of Europe facing the Mediterranean, the service sector is 100 per cent. Gibraltar is not a measure, of course. Each country has its own characteristics. In Germany, for example, the agricultural sector is almost non-existent, less than one per cent. But the industrial sector is about thirty per cent, and the service sector is 69 per cent. Germany and Turkey have roughly the same population of 80-odd million, but Germany produces 5 times more economic value than Turkey. In other words, China’s population is 80 times larger than the Dutch population. The Dutch people produce $1 trillion in the economy. China, on the other hand, produces an economy of 18 trillion. If we consider the population of China, it will produce an economic value of 80 trillion dollars so that it will reach the level of economic prosperity that the Netherlands has reached.
https://commonslibrary.parliament.uk/research-briefings/cbp-8353/
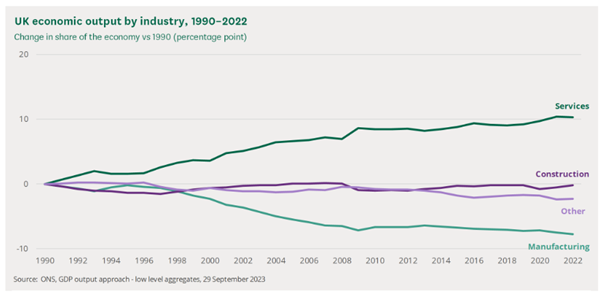
Source: Office for National Statistics (ONS), GDP output approach – low level aggregates, 29 September 2023. Licensed under the Open Government Licence v3.0.
A country needs to plan and invest in both micro and macro terms in which of these sectors it will create an employment area. You will both prepare people for business life and create job opportunities. A country’s ability to create employment is very important. Both in quantity and in duration, speed. How many jobs can you create and how long can you create? It is worth drawing attention to the Economic Freedom Index, which we mentioned in the previous section, which the Heritage Foundation shares with the public every year. The system you have built in the country is extraordinarily effective in this regard. As in the examples of countries with poor performance in the freedom index, starting a small business, that is, creating jobs, can take hundreds of days due to unnecessary bureaucratic obstacles, while in countries with good performance in the index, the same business can be established in seconds.
We need to ensure that the system works very well, to accelerate economic initiatives, and to determine in advance in which areas we need to create employment. What you produce or can produce depends on how well you follow the world and how quickly you adapt yourself to developments. Some countries cannot even adapt to the developing and changing world. Of course, for some countries, it is a great skill to be able to adapt to developments. On the other hand, some countries are leading the way in change and development. The first industrial revolution gained a completely different dimension in the 18th century with the mechanisation of production in light of UK-centred developments. In particular, the textile and steel industries have been greatly affected by these developments. In the second period, that is, in the 19th century. In the 19th century, the revolution took on a different dimension with the invention of aeroplanes and automobiles. After the 1960s, with the introduction of computers into our lives, we experienced the third period of the industrial revolution, the digital revolution, to our bones. Today, the fourth industrial revolution is taking place. With Industry 4.0, the cyber world created with artificial intelligence introduced us to robot technologies and super-cheap vehicles.
In the world where we live in the fourth generation of the industry, it has been a long time since the popular sectors of the first generation left their homeland, that is, today’s developed countries. Textile factories in Bradford, England, have moved to developing countries such as China. The journey towards the factorial riches required by the sectors in their production can be observed very clearly in the last century.
What is produced in an environment where the mind and the liberated, well-educated people, scientists, and minds that direct technology come to life are not the same as the share of production based on cheap labour. On the back of the iPhones, the author says, ‘It was designed in California and assembled in China.’ China’s Foxconn company has a share of 3 to 6 per cent in this production. The lion’s share goes to Apple, the patent holder of the technology that does the research and development. The other part is shared by the Japanese company Toshiba, which produces the memory card, and the South Korean company Samsung, which produces the display. Countries that host production based on the power of the mind get their share of production at that rate. It always depends on having that top culture in directing technology with research and development activities and creating a worldwide brand. Lacoste puts his coat of arms on the shirt he had made for 1 dollar in Indonesia, India and China and sells it for 100 dollars. It takes a few seconds to increase the value of a $1 shirt 100 times and sew the coat of arms on the shirt with the machine.
Table with years as row headers and industry sectors as column headers. Values are percentages of the U.S. economy.
| Year | Agriculture (%) | Manufacturing (%) | Construction (%) | Mining & Utilities (%) | Financial Services (%) | Healthcare (%) | Tech & IT Services (%) | Retail & Wholesale (%) | Other Services (%) |
|---|---|---|---|---|---|---|---|---|---|
| 1975 | 2.3 | 22.0 | 5.2 | 4.1 | 12.5 | 5.0 | 3.0 | 15.2 | 30.7 |
| 1985 | 1.9 | 20.0 | 5.0 | 3.8 | 14.0 | 6.2 | 4.5 | 15.5 | 29.1 |
| 1995 | 1.4 | 17.5 | 4.8 | 3.5 | 16.5 | 7.5 | 6.2 | 15.8 | 26.8 |
| 2005 | 1.2 | 15.0 | 4.5 | 3.3 | 18.0 | 9.2 | 8.5 | 16.0 | 24.3 |
| 2015 | 1.0 | 12.5 | 4.0 | 3.0 | 19.2 | 10.5 | 10.2 | 16.8 | 22.8 |
| 2024 | 0.9 | 11.0 | 3.8 | 2.8 | 20.5 | 12.0 | 11.5 | 17.0 | 20.5 |
Key Trends:
- Manufacturing: Once the backbone of the U.S. economy, its share of GDP declined from 22% in 1975 to about 11% in 2024, as production moved offshore and automation increased.
- Construction: Remained relatively stable, contributing around 4-5% of GDP.
- Mining & Utilities: Shrunk slightly as coal and traditional fossil fuel extraction declined while renewables expanded.
- Financial Services: Expanded significantly, growing from 12.5% in 1975 to over 20% in 2024, reflecting the rise of banking, insurance, and investment markets.
- Healthcare: Has more than doubled, from 5% in 1975 to 12% in 2024, due to rising medical costs and an aging population.
- Tech & IT Services: Rapidly growing, moving from 3% in 1975 to 11.5% in 2024, with Silicon Valley leading innovations in AI, cloud computing, and digital services.
- Retail & Wholesale: Stayed fairly consistent at around 15-17%, driven by e-commerce growth and consumer spending.
- Other Services (includes tourism, entertainment, personal services, etc.): Saw a slow decline as other sectors expanded.
